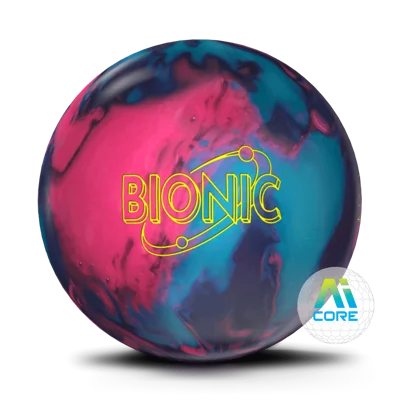
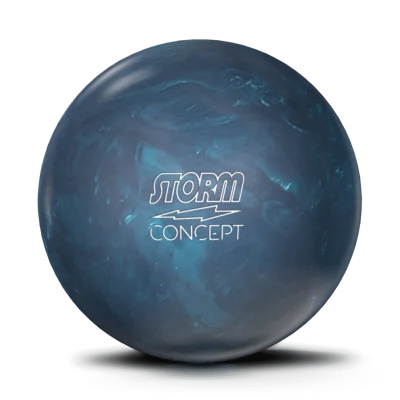
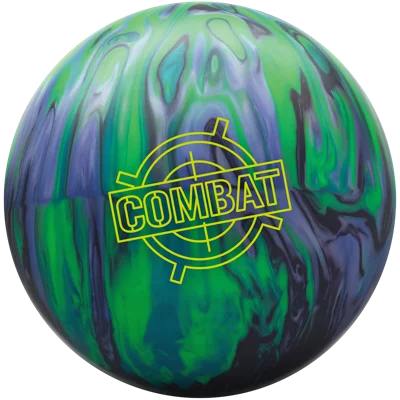
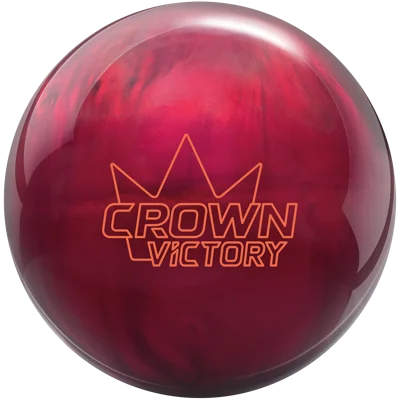
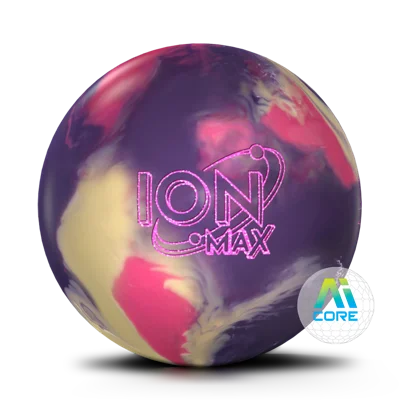
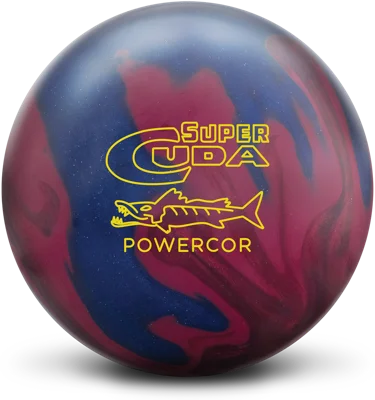
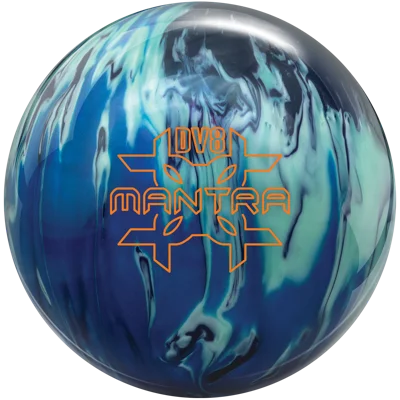
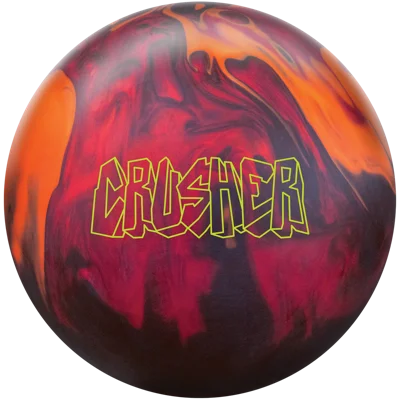
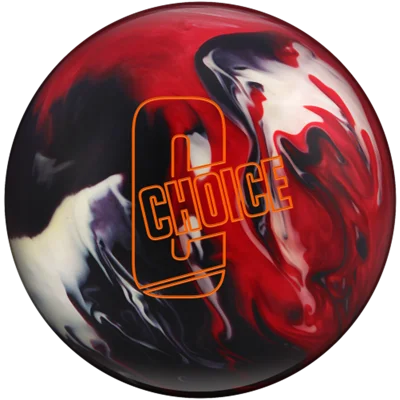
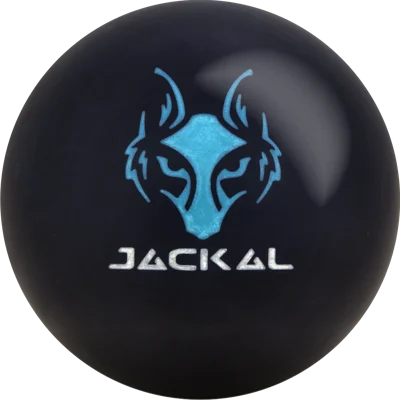
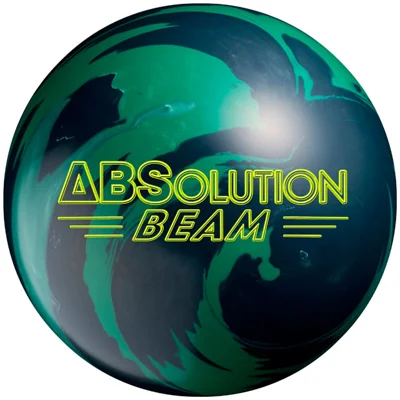
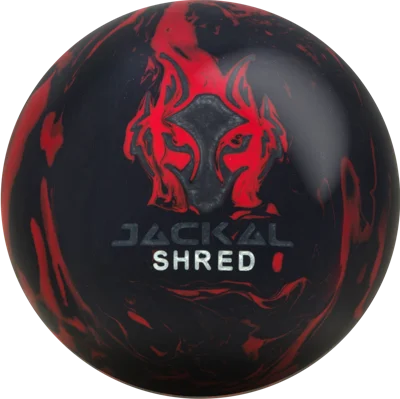
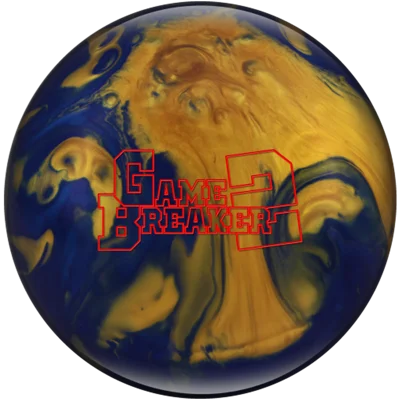
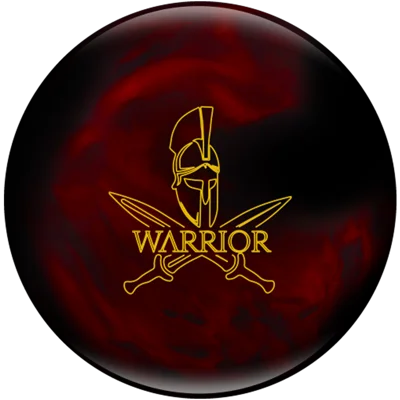
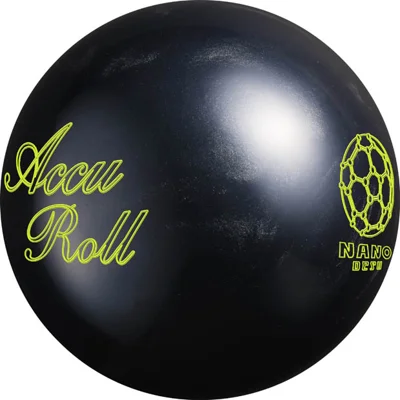
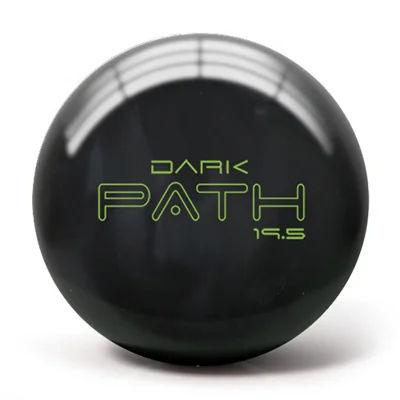
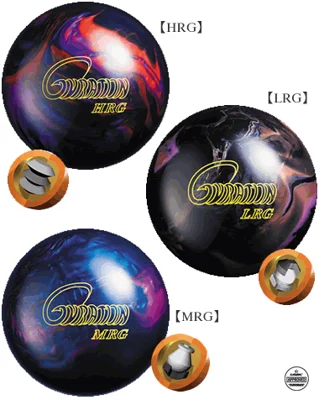
Ball Motion Chart
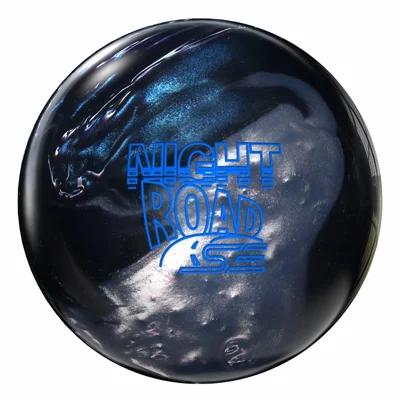
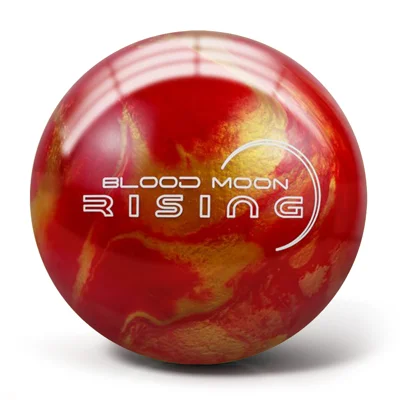
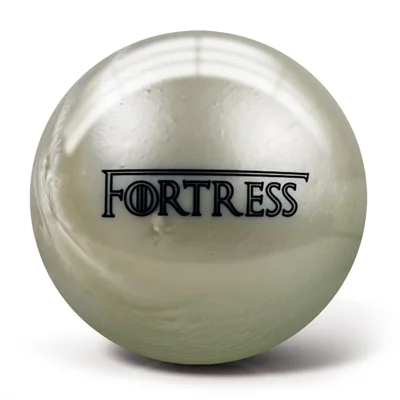
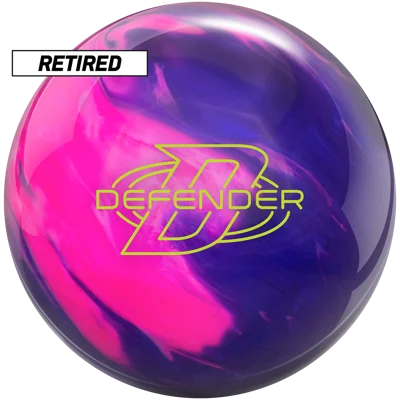
Every brand on one field — 974 balls. Left to right: smooth to angular reaction. Bottom to top: dry lanes to heavy oil. Hover or tap a ball; click through for full specs.


Tap again for full specs →
No balls match those filters — try removing one.
How balls are placed
Positions are computed from each ball's published data — the manufacturer's intended oil condition anchors the vertical axis, while coverstock type, factory finish, core symmetry, RG, and differential shape both axes. Manufacturer ratings are relative to their own lineups, so cross-brand positions are a good guide, not a lab measurement. Spare balls are not plotted — they're designed to go straight. Oil conditions marked "est." are CarryDown estimates.